Free Access
Fig. 1
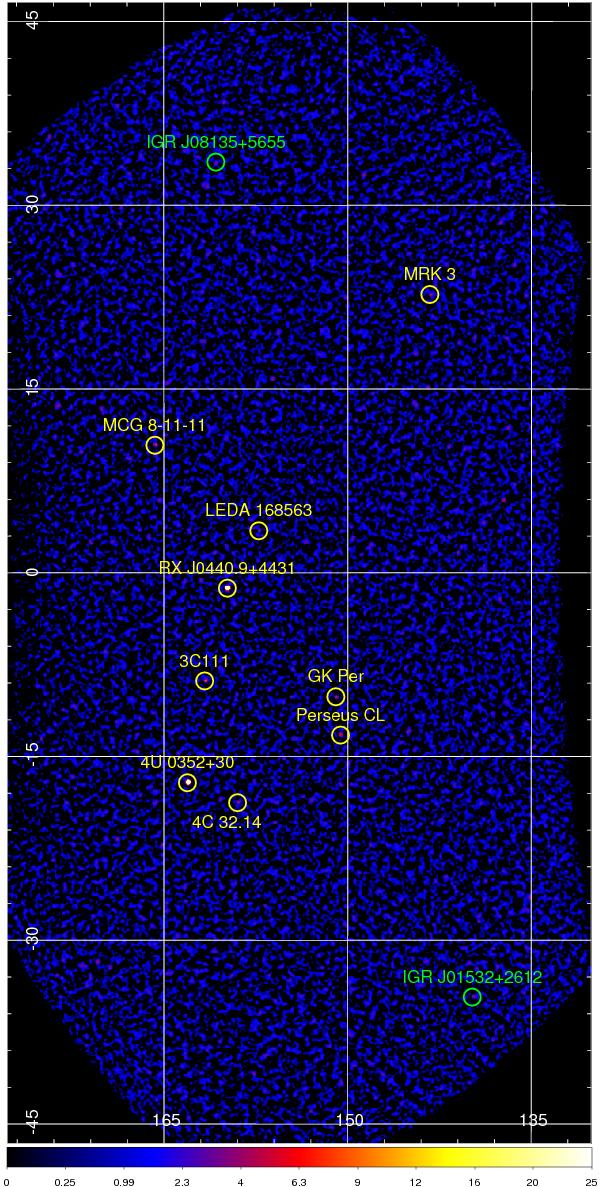
IBIS/ISGRI sky image of the 1 Ms observation of the GA region at l = 155° produced in the 25–60 keV energy range. The color table of the image represents pixel values in the range 0–25 calculated as the square root of the significance. The cataloged and newly detected sources are labeled in yellow and green, respectively.
Current usage metrics show cumulative count of Article Views (full-text article views including HTML views, PDF and ePub downloads, according to the available data) and Abstracts Views on Vision4Press platform.
Data correspond to usage on the plateform after 2015. The current usage metrics is available 48-96 hours after online publication and is updated daily on week days.
Initial download of the metrics may take a while.