Fig. 8
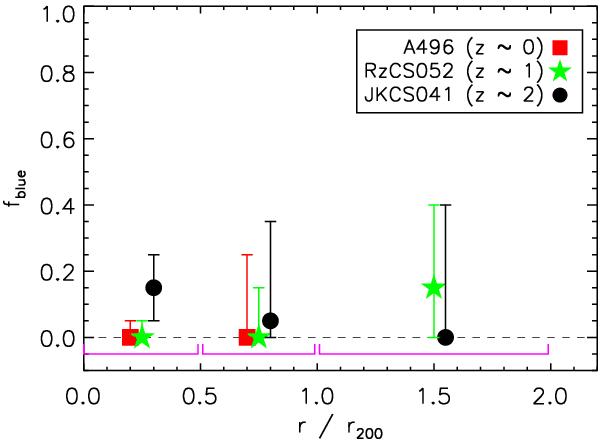
Blue fraction as a function of the cluster-centric distance: JKCS 041 (z ~ 2, black dots), RzCS 052 (z ~ 1, green stars), and A496 (z ~ 0, red squares). Points indicate the maximum a posteriori, the error bars the shortest 68% interval. The three radial ranges used are indicated by the magenta lines. Abscissae are slightly shifted for readability.
Current usage metrics show cumulative count of Article Views (full-text article views including HTML views, PDF and ePub downloads, according to the available data) and Abstracts Views on Vision4Press platform.
Data correspond to usage on the plateform after 2015. The current usage metrics is available 48-96 hours after online publication and is updated daily on week days.
Initial download of the metrics may take a while.