Fig. 4
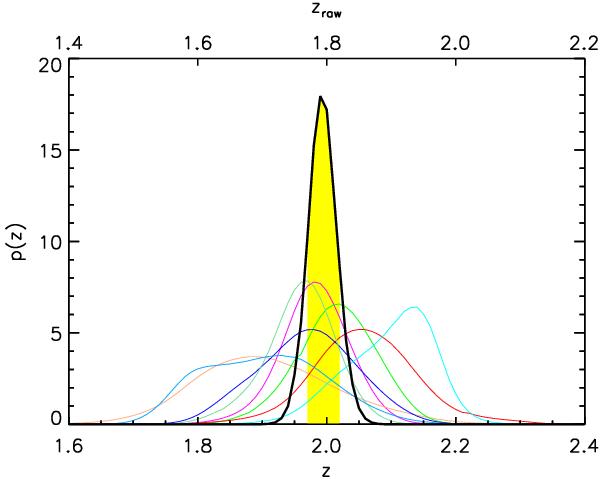
JKCS 041 photometric redshift estimate: the thick black line shows the cluster photometric redshift, the thin coloured lines represent the photometric redshifts of the eight bright galaxies on the cluster red sequence shown in Fig. 3. The area shaded in yellow represents the 1σ confidence interval. The top axis shows the raw photometric redshift, which is not corrected for the known underestimate of the photometric redshifts.
Current usage metrics show cumulative count of Article Views (full-text article views including HTML views, PDF and ePub downloads, according to the available data) and Abstracts Views on Vision4Press platform.
Data correspond to usage on the plateform after 2015. The current usage metrics is available 48-96 hours after online publication and is updated daily on week days.
Initial download of the metrics may take a while.