Fig. 3
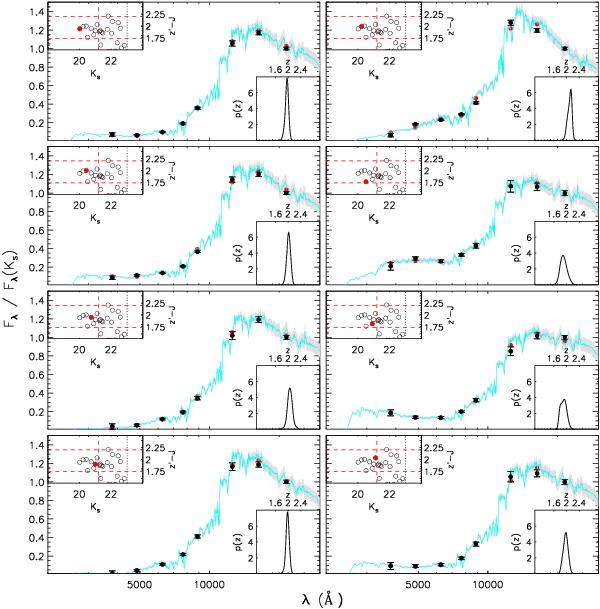
JKCS 041 bright red sequence galaxies analysis. Large panels shows the normalized SED (black dots with error bars), along with the Eazy best-fit template (cyan line) and the best-fit model photometric points (red dots). The thin light gray shaded area around the best-fit template shows the model uncertainty in the best-fit template, as given in Eazy. Upper-left insets: colour–magnitude relation of all galaxies within 0.5 × r200. The closed (red) point emphasizes the object whose SED is shown. Red dashed lines represent cuts in magnitude and colour used in this plot, whereas the black vertical dotted line represents the Ks = 23 limit. Lower-right insets: photometric redshift probability distribution function p(z) for the considered galaxy. All those red and bright galaxies have a SED with a prominent 4000 Å break and are well fitted with a template at z ~ 2.0.
Current usage metrics show cumulative count of Article Views (full-text article views including HTML views, PDF and ePub downloads, according to the available data) and Abstracts Views on Vision4Press platform.
Data correspond to usage on the plateform after 2015. The current usage metrics is available 48-96 hours after online publication and is updated daily on week days.
Initial download of the metrics may take a while.