Fig. 2
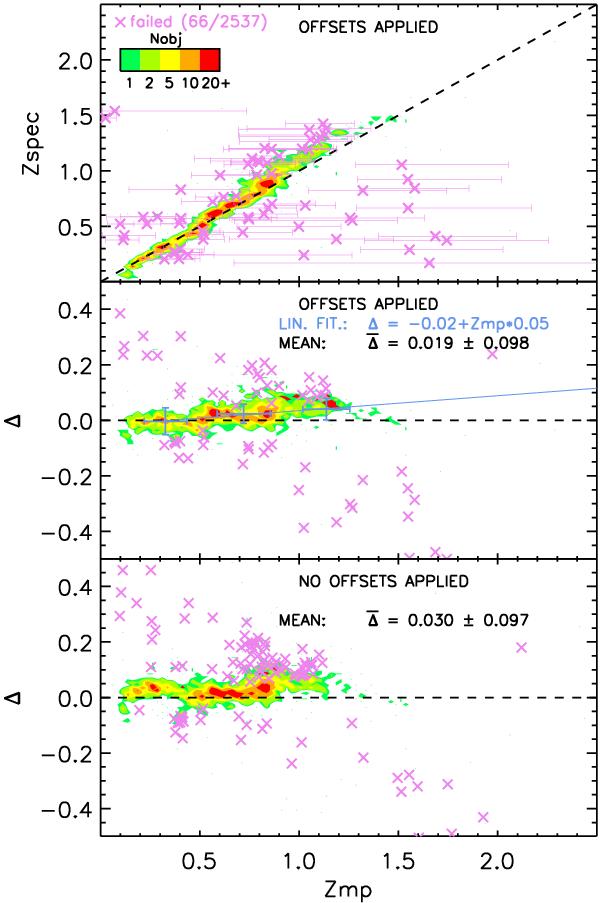
Performance of the photometric redshift estimate: contours indicate the density of objects at each location. In this figure only, we consider that the photometric redshift estimate fails when zspec does not belong to the 3σ confidence interval of zmp (light magenta). Upper panel: zspec vs. zmp when offsets are applied. Middle panel: residuals Δ = (zspec − zmp)/(1 + zmp) vs. zmp when offsets are applied. The light blue line is a linear fit to the three points in light blue, representing the median values when the data are binned in three bins. We observe that zspec ≳ 1 galaxies tend to have their zmp value underestimated (cf. light blue line). Lower panel: residuals Δ vs. zmp when no offsets are applied.
Current usage metrics show cumulative count of Article Views (full-text article views including HTML views, PDF and ePub downloads, according to the available data) and Abstracts Views on Vision4Press platform.
Data correspond to usage on the plateform after 2015. The current usage metrics is available 48-96 hours after online publication and is updated daily on week days.
Initial download of the metrics may take a while.