Free Access
Fig. 12
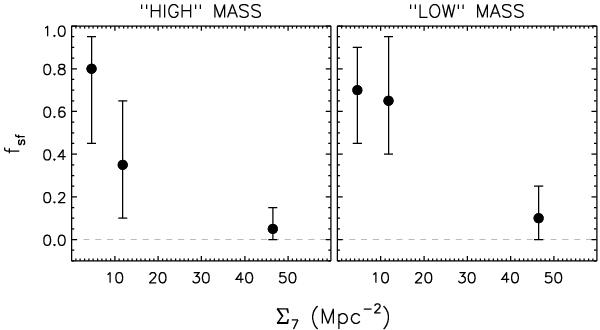
JKCS 041 star-forming fraction fsf vs. density Σ7 for the high-mass subsample (left column) and the less massive subsample (right column). The plotted values for Σ7 are the mean values of the best-fit profile in Fig. 11 (red line) for each radial range, after background subtraction.
Current usage metrics show cumulative count of Article Views (full-text article views including HTML views, PDF and ePub downloads, according to the available data) and Abstracts Views on Vision4Press platform.
Data correspond to usage on the plateform after 2015. The current usage metrics is available 48-96 hours after online publication and is updated daily on week days.
Initial download of the metrics may take a while.