Fig. 8
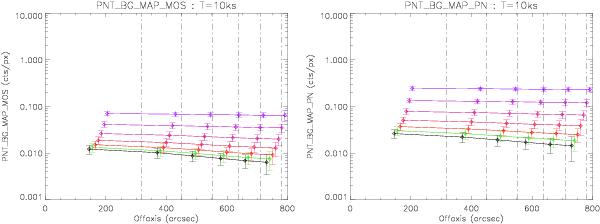
Pipeline-estimated background values on MOS (left) and PN (right) detectors, in the soft band, as seen in the simulations. Curves from bottom to top stand for background ratios B equal to 0.1, 0.25, 0.5, 1, 2, 4 and 8. This plot shows how the local background estimate output of the detection algorithm can be related to the background ratio parameter introduced in the simulations. The error bars represent 1-σ standard variation computed from the source sample. The vertical lines correspond to bounds of our equal-area off-axis bins. Only the results for 10 ks are displayed and similar relations are extracted for 7, 20, 40 and 80 ks pointings.
Current usage metrics show cumulative count of Article Views (full-text article views including HTML views, PDF and ePub downloads, according to the available data) and Abstracts Views on Vision4Press platform.
Data correspond to usage on the plateform after 2015. The current usage metrics is available 48-96 hours after online publication and is updated daily on week days.
Initial download of the metrics may take a while.