Fig. 4
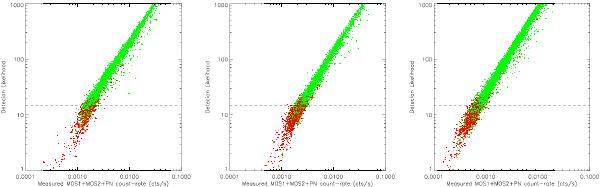
Examples of likelihood versus count-rate plots for three combinations of pointing exposures and background ratios from our soft band simulation set. Green symbols show detections with a real input counterpart while red points indicate spurious (false) detections. All sources within 5 arcmin from the pointing center are shown here. Left: 540 pointings with Texp = 10 ks, background ratio = 1; Middle: 540 pointings with Texp = 10 ks, background ratio = 4; Right: 540 pointings with Texp = 40 ks, background ratio = 1. The horizontal line corresponds to ML = 15, the threshold above which detected sources are included in the catalog. The separation between false and real detections is relatively independent of the pointing quality.
Current usage metrics show cumulative count of Article Views (full-text article views including HTML views, PDF and ePub downloads, according to the available data) and Abstracts Views on Vision4Press platform.
Data correspond to usage on the plateform after 2015. The current usage metrics is available 48-96 hours after online publication and is updated daily on week days.
Initial download of the metrics may take a while.