Fig. 3
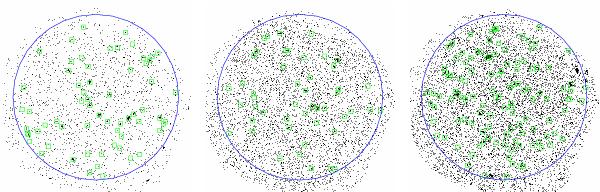
Examples of simulated XMM-Newton pointings in the soft band. The large blue circle indicates the region in which the source detection is performed (13 arcmin maximal off-axis angle). Green boxes indicate the positions of sources detected with a likelihood ML > 15. Left: Texp = 10 ks, background ratio = 1; Middle: Texp = 10 ks, background ratio = 4; Right: Texp = 40 ks, background ratio = 1.
Current usage metrics show cumulative count of Article Views (full-text article views including HTML views, PDF and ePub downloads, according to the available data) and Abstracts Views on Vision4Press platform.
Data correspond to usage on the plateform after 2015. The current usage metrics is available 48-96 hours after online publication and is updated daily on week days.
Initial download of the metrics may take a while.