Fig. 15
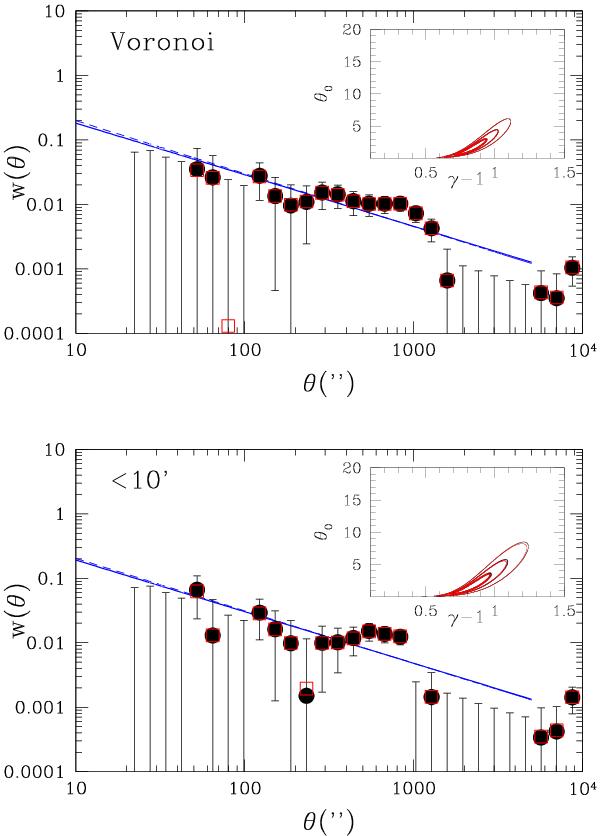
Soft band ACF for the whole sample: Voronoi delimitation (top panel); off-axis angle < 10′ (lower panel). The filled (black) points correspond to the Hamilton estimator while the open (red) squares to the Landy & Szalay estimator. The error bars represent 1σ standard deviation. The dashed line represents the best power-law fit, while the continuous line corresponds to the constant γ = 1.8 fit. The inset plot presents the 1, 2 and 3σ contours in the fitted (θ0,γ) parameter space.
Current usage metrics show cumulative count of Article Views (full-text article views including HTML views, PDF and ePub downloads, according to the available data) and Abstracts Views on Vision4Press platform.
Data correspond to usage on the plateform after 2015. The current usage metrics is available 48-96 hours after online publication and is updated daily on week days.
Initial download of the metrics may take a while.