Fig. 1
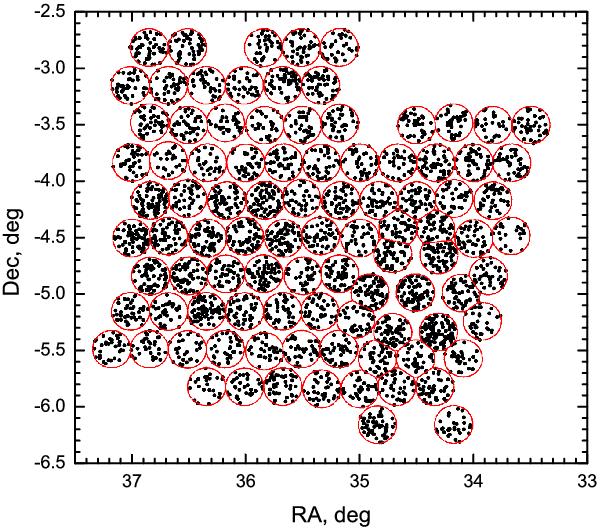
Distribution of the X-ray point-like sources observed in the soft band within the whole XMM-LSS field with an off-axis distance less than 10′. The red circles represent the borders between the different pointings. Note that even when using the 10′ limitation, we may have some overlapping regions. We discarded these minor overlaps using the Voronoi tessellation method.
Current usage metrics show cumulative count of Article Views (full-text article views including HTML views, PDF and ePub downloads, according to the available data) and Abstracts Views on Vision4Press platform.
Data correspond to usage on the plateform after 2015. The current usage metrics is available 48-96 hours after online publication and is updated daily on week days.
Initial download of the metrics may take a while.