Fig. 9
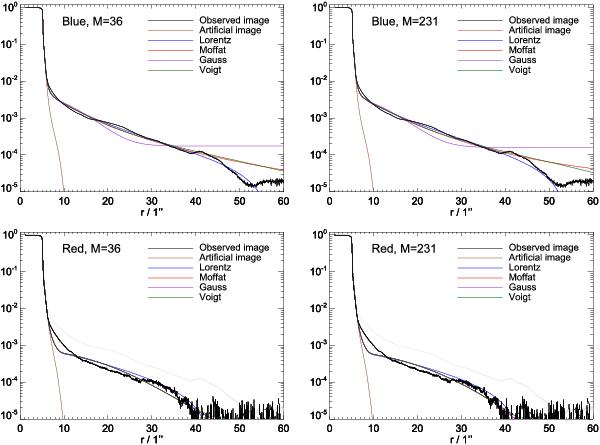
Fit results, angular averages of the masked images, centered on the 1 mm hole A. Beam and M as noted in the plot legends. Black: observed image; gray (in the red plots): blue observed image; brown: binary image convolved with sφ estimated with M = 231; other colors: binary image convolved with sφ as well as sK fitted with kernels as listed.
Current usage metrics show cumulative count of Article Views (full-text article views including HTML views, PDF and ePub downloads, according to the available data) and Abstracts Views on Vision4Press platform.
Data correspond to usage on the plateform after 2015. The current usage metrics is available 48-96 hours after online publication and is updated daily on week days.
Initial download of the metrics may take a while.