Fig. 4
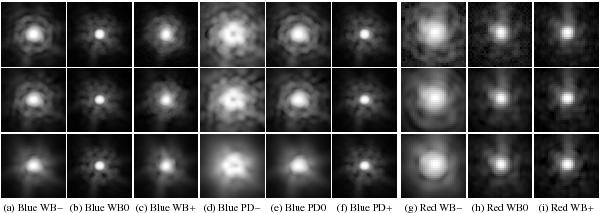
PD results, the central parts of target hole F images in log scale. Top
row: observed image; center row: recreated images
M = 231; bottom row: recreated images
M = 36. The FOV shown is 2 2 × 22 in the blue and
19 × 19 in the red. Beam, camera and
diversity as noted in subcaptions a)–i).
2 × 22 in the blue and
19 × 19 in the red. Beam, camera and
diversity as noted in subcaptions a)–i).
Current usage metrics show cumulative count of Article Views (full-text article views including HTML views, PDF and ePub downloads, according to the available data) and Abstracts Views on Vision4Press platform.
Data correspond to usage on the plateform after 2015. The current usage metrics is available 48-96 hours after online publication and is updated daily on week days.
Initial download of the metrics may take a while.