Free Access
Fig. 3
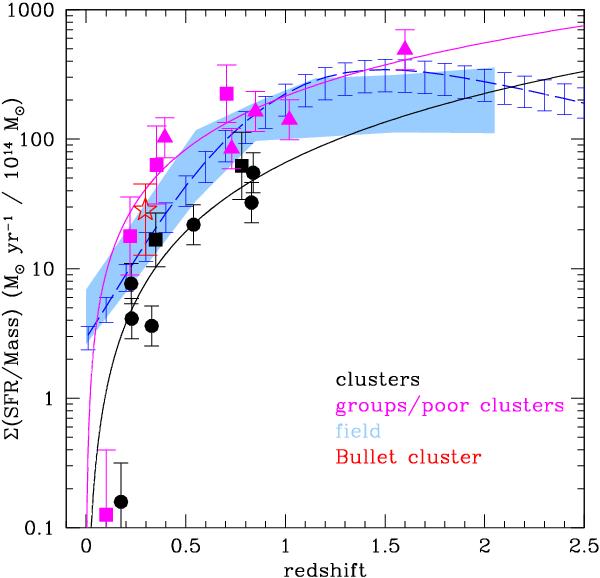
The field Σ(SFR)/M-redshift relation from Magnelli et al. (2011) (light blue shaded region) and Gruppioni et al. (2011) (dashed blue line). The shading and error bars represent 1σ confidence levels Other symbols/lines have the same meaning of the symbols as in Fig. 2.
Current usage metrics show cumulative count of Article Views (full-text article views including HTML views, PDF and ePub downloads, according to the available data) and Abstracts Views on Vision4Press platform.
Data correspond to usage on the plateform after 2015. The current usage metrics is available 48-96 hours after online publication and is updated daily on week days.
Initial download of the metrics may take a while.