Fig. 2
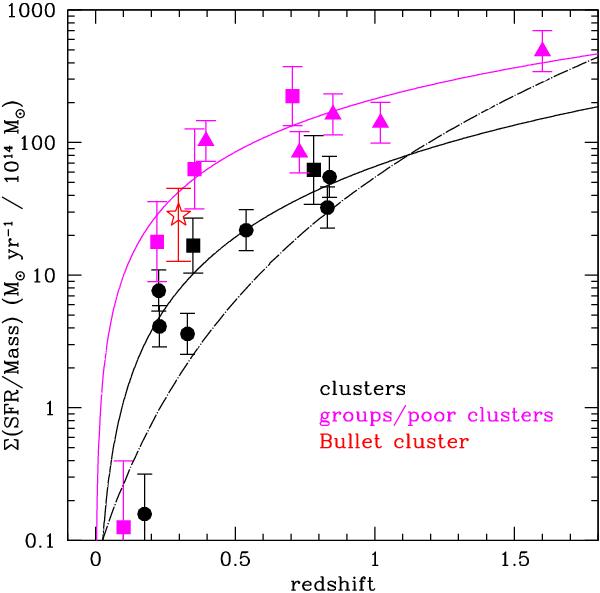
Σ(SFR)/M- redshift relation for clusters (black symbols) and groups (magenta symbols). Square symbols, triangles, and dots identify, respectively, the COSMOS composite systems, the GOODS systems, and the remaining systems. The red star identifies the Bullet cluster. The black solid line shows the best fit Σ(SFR)/M – z relation for the cluster sample, excluding the Bullet cluster. The relation fitted to the data is of the type Σ(SFR)/M ∝ zα. The dashed line shows the relation, Σ(SFR)/M ∝ (1 + z)α, of Bai et al. (2009) rescaled to the LIRG LIR-regime and to the r200 region. The magenta solid line shows the best fit for the sample of groups and poor clusters.
Current usage metrics show cumulative count of Article Views (full-text article views including HTML views, PDF and ePub downloads, according to the available data) and Abstracts Views on Vision4Press platform.
Data correspond to usage on the plateform after 2015. The current usage metrics is available 48-96 hours after online publication and is updated daily on week days.
Initial download of the metrics may take a while.