Fig. 7
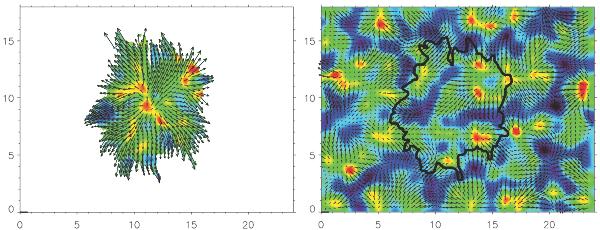
LCT flow maps of the longitudinal magnetogram of the smoothed simulation (left) and its corresponding continuum image (right). Units in axes are Mm. Separation length between tickmarks is equivalent to a velocity magnitude of 1.1 kms-1. The background image represents the normalized divergence field in every case, with positive values (in red), marking clearly the emergence areas, and negative divergences (in blue), featuring long-duration lanes and probably mesogranular lanes. Black contour delimits the magnetic field over the divergence in the right panel.
Current usage metrics show cumulative count of Article Views (full-text article views including HTML views, PDF and ePub downloads, according to the available data) and Abstracts Views on Vision4Press platform.
Data correspond to usage on the plateform after 2015. The current usage metrics is available 48-96 hours after online publication and is updated daily on week days.
Initial download of the metrics may take a while.