Fig. 4
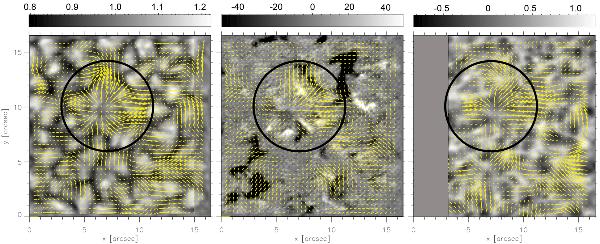
From left to right: flow maps of the continuum, COG longitudinal field and LOS-velocity of the ℓ10 emergence. Background images are average images of the following quantities: average normalized continuum image; longitudinal magnetic field, clipped to ± 50 G; and LOS-velocity (kms-1 ). The full FOV is  . Separation length between tickmarks is equivalent to a velocity magnitude of 1.5 kms-1. A circle of diameter 8
 3 (same as in Fig. 2) is overplotted for comparison. See text for more details.
Current usage metrics show cumulative count of Article Views (full-text article views including HTML views, PDF and ePub downloads, according to the available data) and Abstracts Views on Vision4Press platform.
Data correspond to usage on the plateform after 2015. The current usage metrics is available 48-96 hours after online publication and is updated daily on week days.
Initial download of the metrics may take a while.