Fig. 3
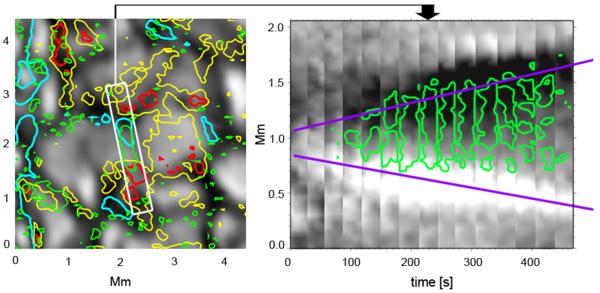
Emergence event v10. Left: continuum image with contours of transverse magnetic field in green (>180 G) and yellow, blue and red contours as in Fig. 2. A region showing the emergence of a loop is outlined with a white box. Right: corresponding time slices of the magnetic loop emergence. Background image displays the longitudinal field with positive/negative polarities in white/black. Superimposed in green is the transverse field. Reference lines in purple mark the footpoint separation. Time in this panel is counted from the start of the first footpoint emergence, i.e., 698 s after the start of the series. The corresponding sequence from where the left panel is extracted can be found in a movie (v10) in the online edition.
Current usage metrics show cumulative count of Article Views (full-text article views including HTML views, PDF and ePub downloads, according to the available data) and Abstracts Views on Vision4Press platform.
Data correspond to usage on the plateform after 2015. The current usage metrics is available 48-96 hours after online publication and is updated daily on week days.
Initial download of the metrics may take a while.