Fig. 7
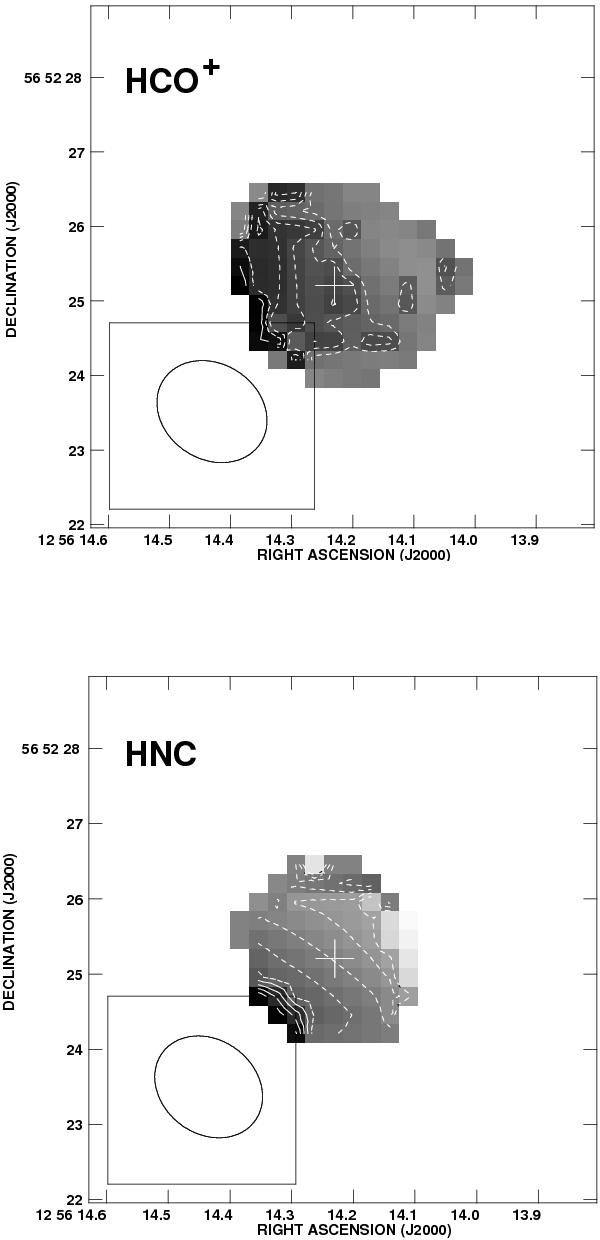
Central HCO+ (top) and HNC (bottom) 1–0 velocity fields. The grayscale range is from − 64 to 9 km s-1 (top) and from − 43 to 24 km s-1 (bottom). The contour levels are 5 km s-1 × (–4, –3, –2, –1, 0, 1, 2, 3, 4). (1′′ = 870 pc and zero velocity was set to redshift z = 0.042170 for all lines). Cross refers to the center of the 85 GHz continuum. The emission is integrated over ± 200 km s-1 and excludes the line wings. Ellipse indicates beam size and orientation.
Current usage metrics show cumulative count of Article Views (full-text article views including HTML views, PDF and ePub downloads, according to the available data) and Abstracts Views on Vision4Press platform.
Data correspond to usage on the plateform after 2015. The current usage metrics is available 48-96 hours after online publication and is updated daily on week days.
Initial download of the metrics may take a while.