Fig. 1
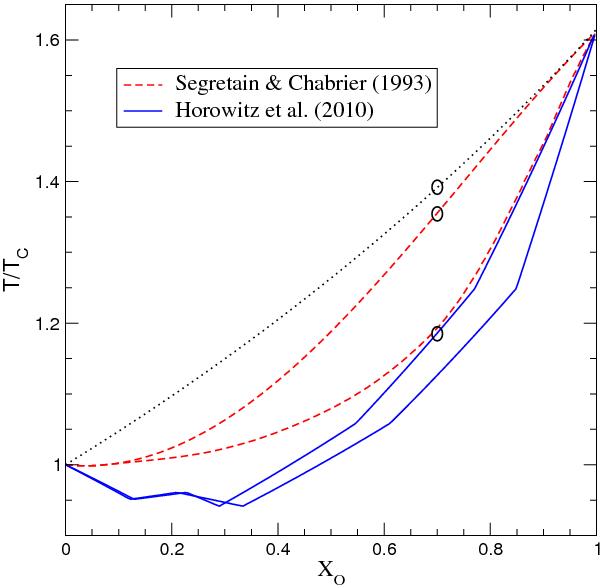
Carbon-oxygen phase diagrams used in our evolutionary calculations. The crystallization temperature of the carbon-oxygen binary mixture in terms of the crystallization temperature of pure carbon is shown as a function of the oxygen abundance by mass. Dashed red lines and solid blue lines correspond, respectively, to the phase diagrams of Segretain & Chabrier (1993) and Horowitz et al. (2010). For each diagram, the upper curve gives the crystallization temperature for a given oxygen abundance of the liquid, while the lower curve provides the equilibrium oxygen abundance of the solid at this temperature. The dotted line corresponds to the case in which no phase separation occurs, and the mixture is treated as the average of the chemical species. Finally, the circles denote the crystallization temperature of the carbon-oxygen mixture for the case of an oxygen mass abundance of 0.7, a typical value found in the evolutionary calculations of white dwarf progenitors.
Current usage metrics show cumulative count of Article Views (full-text article views including HTML views, PDF and ePub downloads, according to the available data) and Abstracts Views on Vision4Press platform.
Data correspond to usage on the plateform after 2015. The current usage metrics is available 48-96 hours after online publication and is updated daily on week days.
Initial download of the metrics may take a while.