Free Access
Fig. 6
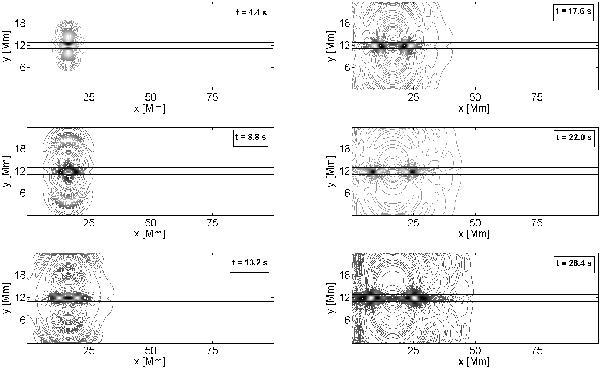
The time evolution of the pressure variance Δp = p(t) − p(0) at various times t, depicted as the contours for the density slab. The borders of the density slab are drawn as the black lines (wsl = 1.0 Mm).
Current usage metrics show cumulative count of Article Views (full-text article views including HTML views, PDF and ePub downloads, according to the available data) and Abstracts Views on Vision4Press platform.
Data correspond to usage on the plateform after 2015. The current usage metrics is available 48-96 hours after online publication and is updated daily on week days.
Initial download of the metrics may take a while.