Free Access
Fig. 11
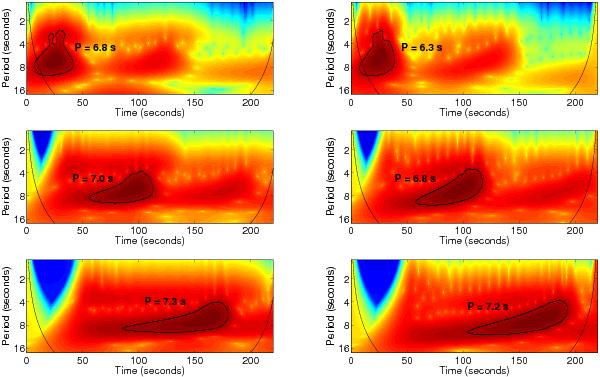
The “time evolutions” and comparison of tadpole shapes in three different detection points LD = L/4,L/2,3L/4 (upper, middle, and lower panel, respectively). In the left column, the results for the density slab are shown, whereas the results for Harris current sheet can be seen in the right column.
Current usage metrics show cumulative count of Article Views (full-text article views including HTML views, PDF and ePub downloads, according to the available data) and Abstracts Views on Vision4Press platform.
Data correspond to usage on the plateform after 2015. The current usage metrics is available 48-96 hours after online publication and is updated daily on week days.
Initial download of the metrics may take a while.