Free Access
Fig. 10
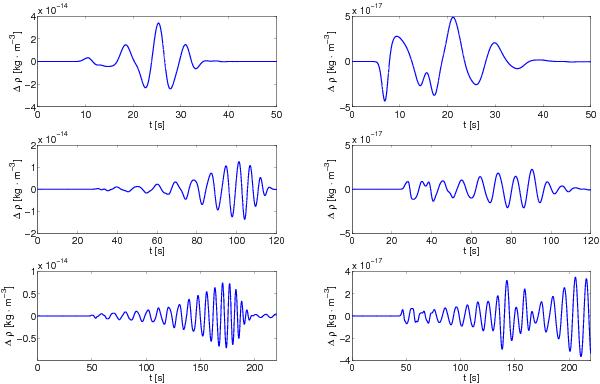
Comparison of incoming wave signals in selected detection points. The data were recorded in LD = L/4,L/2,3L/4 (upper, middle and lower panel, respectively). In the left and right columns, the results for the center (H/2) and 75 Mm (3H/4) above the Harris current sheet are shown.
Current usage metrics show cumulative count of Article Views (full-text article views including HTML views, PDF and ePub downloads, according to the available data) and Abstracts Views on Vision4Press platform.
Data correspond to usage on the plateform after 2015. The current usage metrics is available 48-96 hours after online publication and is updated daily on week days.
Initial download of the metrics may take a while.