Fig. 9
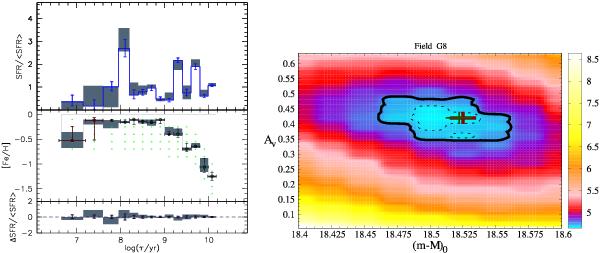
Example of the best-fitting solution in a subregion of tile 4_3. Left panel: the top part presents SFR(t)/ ⟨ SFR(t) ⟩ (histograms) with stochastic errors (bars) and systematic variations (shaded regions) vs. log (t/yr). The central part shows the best-fitting AMR recovered (red and black points; red is used in age bins for which the SFR(t) is close to zero) with stochastic errors (red or black vertical bars) and systematic variations (shaded regions). The green dots indicate the central values of [Fe/H] and log (t/yr) of the SPMs. The bottom part shows the variation of the SFR(t) solution with stochastic errors (dashed line and bars) and systematic errors (shaded regions). Right panel: map of the χ2 values (as indicated by the colour scale) as a function of AV and with 1σ (dashed lines) and 3σ (continuous line) contours. The red cross marks the position of the best-fitting model. The green cross marks the position of the best model at the distance of the best-fitting LMC plane.
Current usage metrics show cumulative count of Article Views (full-text article views including HTML views, PDF and ePub downloads, according to the available data) and Abstracts Views on Vision4Press platform.
Data correspond to usage on the plateform after 2015. The current usage metrics is available 48-96 hours after online publication and is updated daily on week days.
Initial download of the metrics may take a while.