Fig. 8
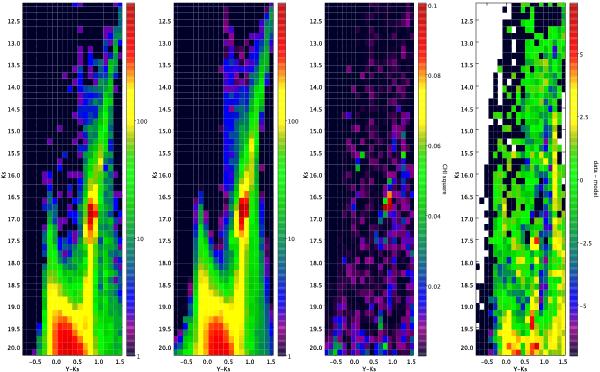
Examples of Hess diagrams obtained during a typical run of StarFISH – in this case, for subregion G1 of tile 8_3, with mag and AV = 0.32 mag. From left to right we show Hess diagrams for a) the original VMC data, within the magnitude and colour limits used in this work, b) the best-fitting model derived by StarFISH, c) the χ2 map, that is the fractional contribution of each CMD bin to the total χ2, d) the difference between data and best-fitting model. In panels a), b) and d), the scale is in units of stars per CMD bin.
Current usage metrics show cumulative count of Article Views (full-text article views including HTML views, PDF and ePub downloads, according to the available data) and Abstracts Views on Vision4Press platform.
Data correspond to usage on the plateform after 2015. The current usage metrics is available 48-96 hours after online publication and is updated daily on week days.
Initial download of the metrics may take a while.