Fig. 7
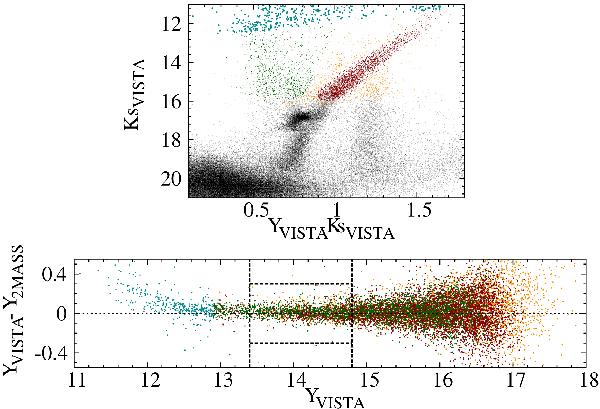
Verification of Eq. (1) when applied to real LMC data. The top panel shows stars in the 8_8 tile, in the Ks vs. diagram of VMC. Different colours are used for likely LMC giants (brown), likely Milky Way dwarfs (green), stars bright enough to be partially saturated (cyan), and stars for which 2MASS photometry is not available (black). The bottom panel shows the difference between the Y magnitude as measured from VMC data, and as inferred from 2MASS photometry via the first Eq. (1), as a function of Y, for stars with both VISTA and 2MASS photometry. The vertical dashed lines denote the magnitude interval for which this comparison is the most significant, as discussed in the text.
Current usage metrics show cumulative count of Article Views (full-text article views including HTML views, PDF and ePub downloads, according to the available data) and Abstracts Views on Vision4Press platform.
Data correspond to usage on the plateform after 2015. The current usage metrics is available 48-96 hours after online publication and is updated daily on week days.
Initial download of the metrics may take a while.