Fig. 2
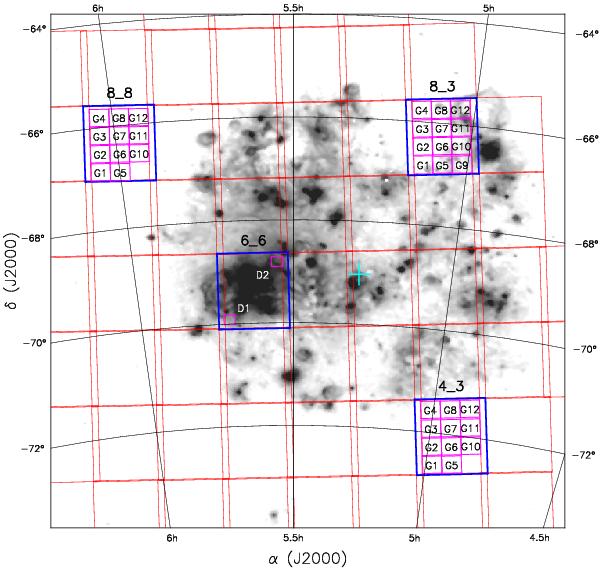
An Hα image of the central LMC from the Southern H-Alpha Sky Survey Atlas (in gray; Gaustad et al. 2001), with VMC tiles marked by red rectangles. The blue and magenta rectangles show the positions of the tiles and subregions, respectively, considered in this work. The cyan cross marks the centre of the LMC as derived by Nikolaev et al. (2004).
Current usage metrics show cumulative count of Article Views (full-text article views including HTML views, PDF and ePub downloads, according to the available data) and Abstracts Views on Vision4Press platform.
Data correspond to usage on the plateform after 2015. The current usage metrics is available 48-96 hours after online publication and is updated daily on week days.
Initial download of the metrics may take a while.