Free Access
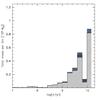
Fig. 17
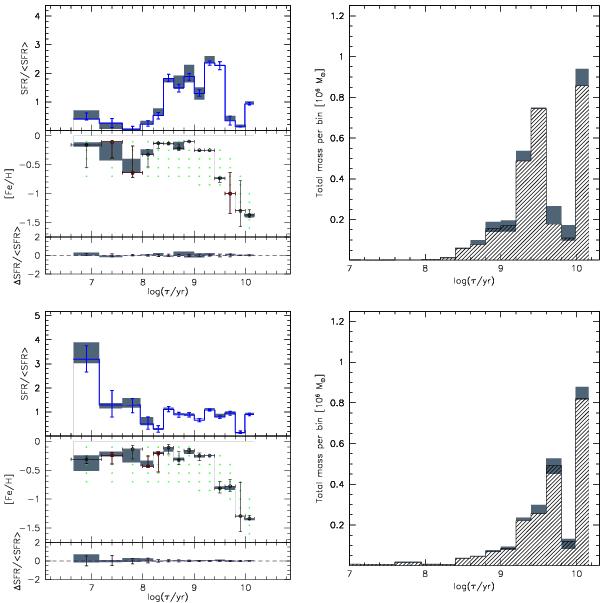
SFH results for subregions D1 (top panels) and D2 (bottom panels) in tile 6_6, assuming a fixed distance. The left panels must be compared to the left panels in Fig. 10, to illustrate the effect of fixing the distance. The right panels show the total mass formed per age bin.
This figure is made of several images, please see below:
Current usage metrics show cumulative count of Article Views (full-text article views including HTML views, PDF and ePub downloads, according to the available data) and Abstracts Views on Vision4Press platform.
Data correspond to usage on the plateform after 2015. The current usage metrics is available 48-96 hours after online publication and is updated daily on week days.
Initial download of the metrics may take a while.