Fig. 14
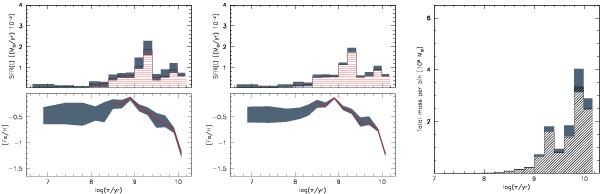
Total SFR(t) and AMR derived for tile 8_8, resulting from the addition of the SFH values for all subregions. Left panels: the SFR(t) as a function of log (t/yr) (red shaded histogram) and its systematic variations (gray), together with the mean AMR in all age bins in which the SFR(t) is non-negligible (red line) and its systematic variations (gray). These results are obtained assuming that both and AV are free parameters. The middle panels show the same but using a fixed – obtained from the best-fitting disk geometry – and assuming that only AV is a free parameter. The right panel shows the total stellar mass formed inside each log (t/yr) bin (shaded histogram) together with the systematic variations (gray area).
Current usage metrics show cumulative count of Article Views (full-text article views including HTML views, PDF and ePub downloads, according to the available data) and Abstracts Views on Vision4Press platform.
Data correspond to usage on the plateform after 2015. The current usage metrics is available 48-96 hours after online publication and is updated daily on week days.
Initial download of the metrics may take a while.