Fig. 13
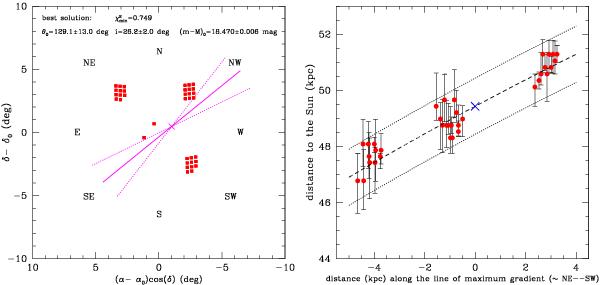
Best-fitting model of the LMC disk using as centre of the LMC the coordinates derived by Nikolaev et al. (2004, cross). Left panel: the line of nodes (solid line) and the 36 tile subregions (red squares) as projected on the sky. The disk parameters are shown in the figure, as well as the uncertainties in the position angle of the line of nodes (dotted lines). Right panel: distance to these subregions projected onto the line perpendicular to the line of nodes, i.e. the line of the maximum LMC disk gradient (~NE–SW direction).
Current usage metrics show cumulative count of Article Views (full-text article views including HTML views, PDF and ePub downloads, according to the available data) and Abstracts Views on Vision4Press platform.
Data correspond to usage on the plateform after 2015. The current usage metrics is available 48-96 hours after online publication and is updated daily on week days.
Initial download of the metrics may take a while.