Free Access
Fig. 1
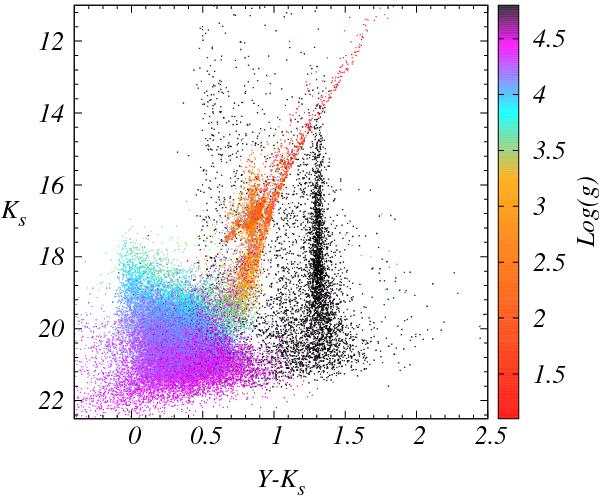
Simulated CMD for a 0.037 deg2 region of moderate stellar density in the LMC. The black points show the distribution of the Milky Way foreground. The coloured dots show the LMC stars according to their surface gravity (in cgs units).
Current usage metrics show cumulative count of Article Views (full-text article views including HTML views, PDF and ePub downloads, according to the available data) and Abstracts Views on Vision4Press platform.
Data correspond to usage on the plateform after 2015. The current usage metrics is available 48-96 hours after online publication and is updated daily on week days.
Initial download of the metrics may take a while.