Fig. 8
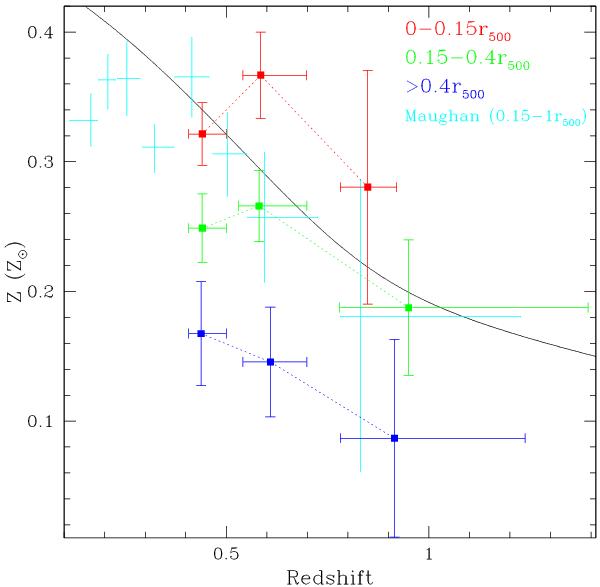
Mean weighted abundance in our XMM-Newton sample as a function of the redshift for the clusters in our sample in different spatial bins: 0–0.15 r500 plotted in red, 0.15–0.4 r500 in green, and > 0.4r500 in blue. The error bars represent the error in the mean and are listed in Table 5. The cyan points represent the weighted abundance measured by MAU08 for a sample of 116 clusters. The abundance values expected at different redshifts in the Ettori (2005) model are plotted as a solid black line.
Current usage metrics show cumulative count of Article Views (full-text article views including HTML views, PDF and ePub downloads, according to the available data) and Abstracts Views on Vision4Press platform.
Data correspond to usage on the plateform after 2015. The current usage metrics is available 48-96 hours after online publication and is updated daily on week days.
Initial download of the metrics may take a while.