Fig. 7
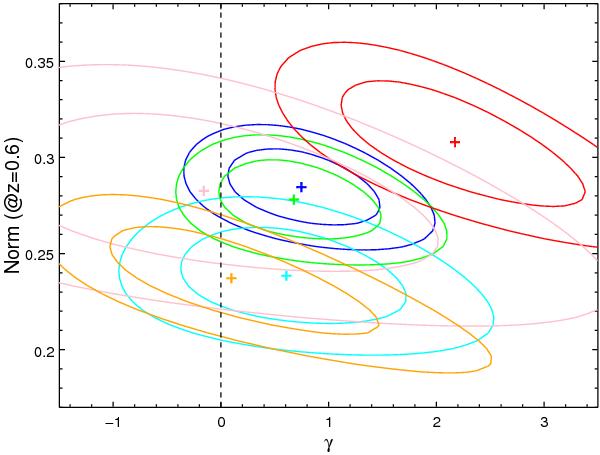
Confidence contours (computed at 1σ and 2σ for two interesting parameters) on γ and normalization (referred to z = 0.6) for all the datasets analyzed in Sect. 5.1. Blue and cyan contours refer to our 0−0.6r500 sample and our 0.15−0.6r500 sample, respectively. The contours for MAU08 samples (computed excluding CLJ1415.1+3612, see text and Table 4) at r = 0−1r500 and r = 0.15−1r500 are plotted in red and pink, respectively. Green contours refer to the BLS07 sample, while orange contours are plotted for the Anderson et al. (2009) dataset.
Current usage metrics show cumulative count of Article Views (full-text article views including HTML views, PDF and ePub downloads, according to the available data) and Abstracts Views on Vision4Press platform.
Data correspond to usage on the plateform after 2015. The current usage metrics is available 48-96 hours after online publication and is updated daily on week days.
Initial download of the metrics may take a while.