Fig. 9
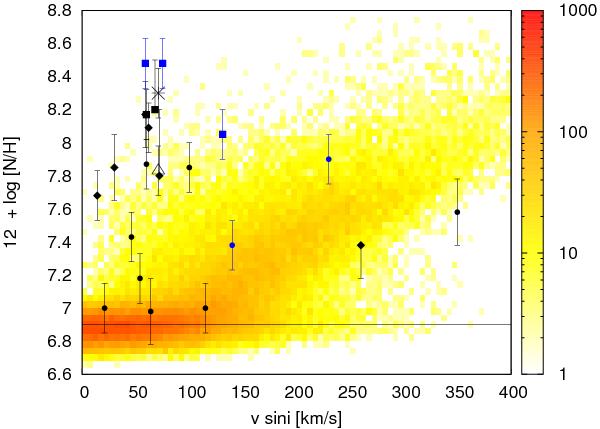
“Hunter-plot” displaying the nitrogen abundance vs. projected rotational speed. Population synthesis from Brott et al. (2011b), for Teff ≥ 29 kK and a magnitude limit V ≤ 15.29, shown as a density plot in the background. The color coding corresponds to the number of stars per bin, with binsize 5 km s-1 × 0.04 dex. Overplotted are data from this study. Black: N11 stars; blue: field stars. Circles, diamonds and squares correspond to objects with low, intermediate and strong helium enrichment, respectively (see text). Alternative solutions for N11-031 (intermediate He enrichment) as in Fig. 8.
Current usage metrics show cumulative count of Article Views (full-text article views including HTML views, PDF and ePub downloads, according to the available data) and Abstracts Views on Vision4Press platform.
Data correspond to usage on the plateform after 2015. The current usage metrics is available 48-96 hours after online publication and is updated daily on week days.
Initial download of the metrics may take a while.