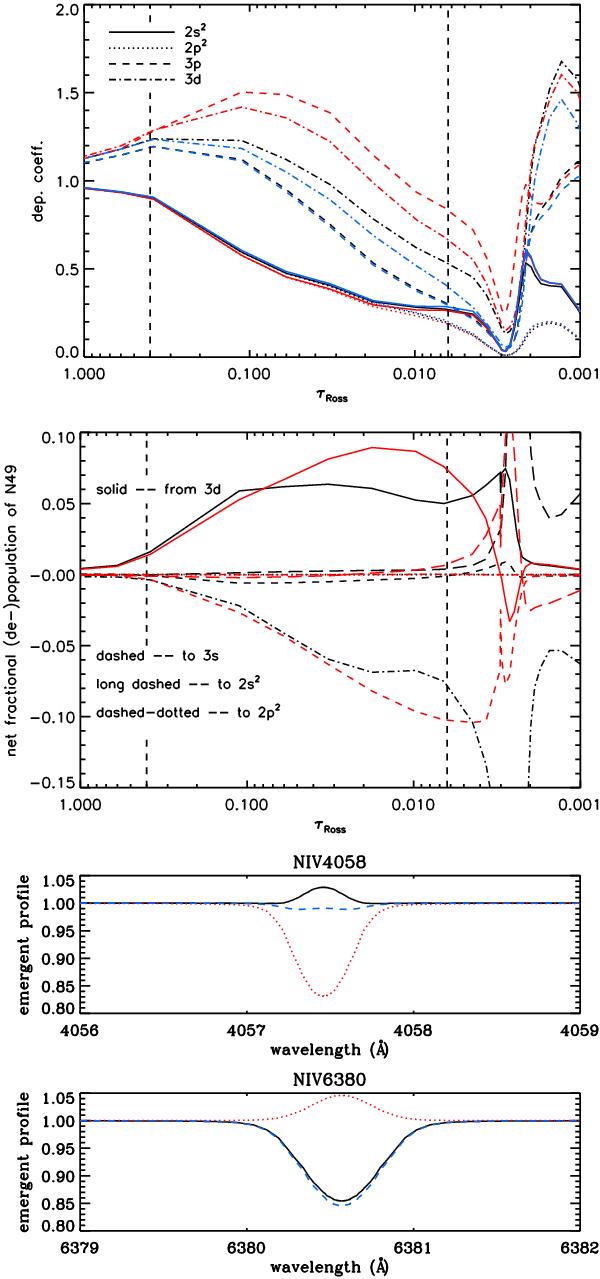
Fig. 3

Departure coefficients, fractional net rates, and line profiles for N ivλ4058/λ6380 and involved processes, for model “A4540”. Designation for 2p2 refers to 2p2 2D only since the other fine-structure component, 2p2 2S, behaves similarly. Upper panel: NLTE departure coefficients as a function of τRoss. The onset of the wind is clearly visible at τRoss ≈ 0.003. Black curves: standard model with b3d > b3p; red curves: draining transitions 3p → 2p2 suppressed, leading to b3d < b3p; blue curves: transition 2p → 3d suppressed. Middle panel: fractional net rates to and from 3p, for the standard model (black) and the model with suppressed draining transitions (red). Lower panel: line profiles for N ivλ4058 and λ6380, for the three models displayed in the upper panel, with similar color coding.
Current usage metrics show cumulative count of Article Views (full-text article views including HTML views, PDF and ePub downloads, according to the available data) and Abstracts Views on Vision4Press platform.
Data correspond to usage on the plateform after 2015. The current usage metrics is available 48-96 hours after online publication and is updated daily on week days.
Initial download of the metrics may take a while.


