Free Access
Fig. 2
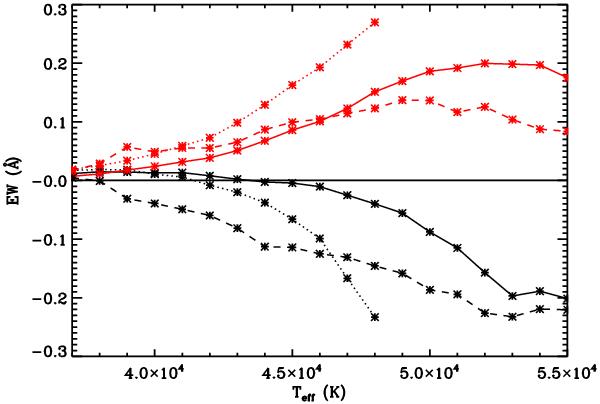
Equivalent width (positive for absorption) of N ivλ4058 (black) and N ivλ6380 (red) as a function of Teff. Solid and dotted curves refer to low Ṁ (model series “A”) with log g = 4.0 and 3.7, respectively, and dashed curves to supergiant mass-loss rates (model series “E”), with log g = 4.0.
Current usage metrics show cumulative count of Article Views (full-text article views including HTML views, PDF and ePub downloads, according to the available data) and Abstracts Views on Vision4Press platform.
Data correspond to usage on the plateform after 2015. The current usage metrics is available 48-96 hours after online publication and is updated daily on week days.
Initial download of the metrics may take a while.