Fig. 7
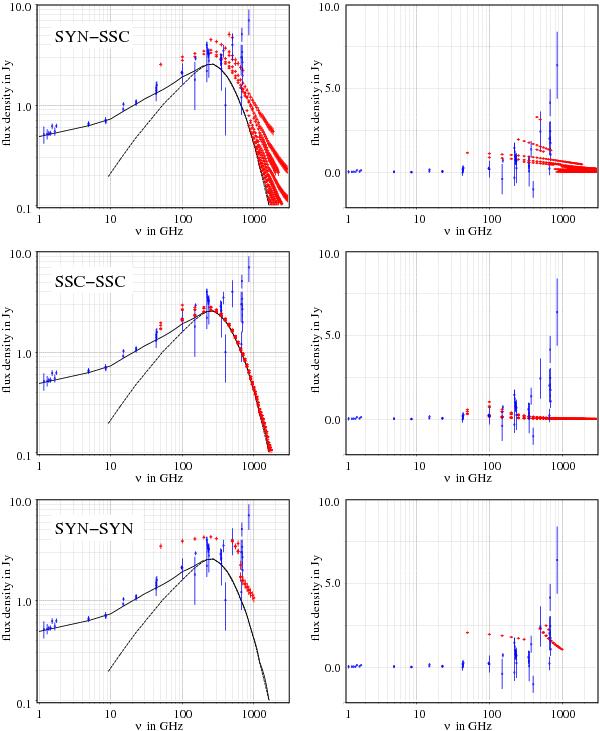
Observed flux densities of SgrA* taken from the literature (blue) compared to a combined model that consists of the fit given by Falcke et al. (2000), Marrone et al. (2003) (black line), and Dexter et al. (2010) (black dashed line). The spectrum of synchrotron self-absorption frequencies for the range of models discussed here is shown in red. We show results for the SYN-SSC (top), SSC-SSC (middle), and SYN-SYN (bottom) models corresponding to the parameters in Table 5. The SYN-SSC (top) is the preferred model and represents most closely the observed variability of SgrA*. On the left, we show the complete model, on the right we show only the variable flux densities as observed (blue), as well as modeled (red).
Current usage metrics show cumulative count of Article Views (full-text article views including HTML views, PDF and ePub downloads, according to the available data) and Abstracts Views on Vision4Press platform.
Data correspond to usage on the plateform after 2015. The current usage metrics is available 48-96 hours after online publication and is updated daily on week days.
Initial download of the metrics may take a while.