Fig. 4
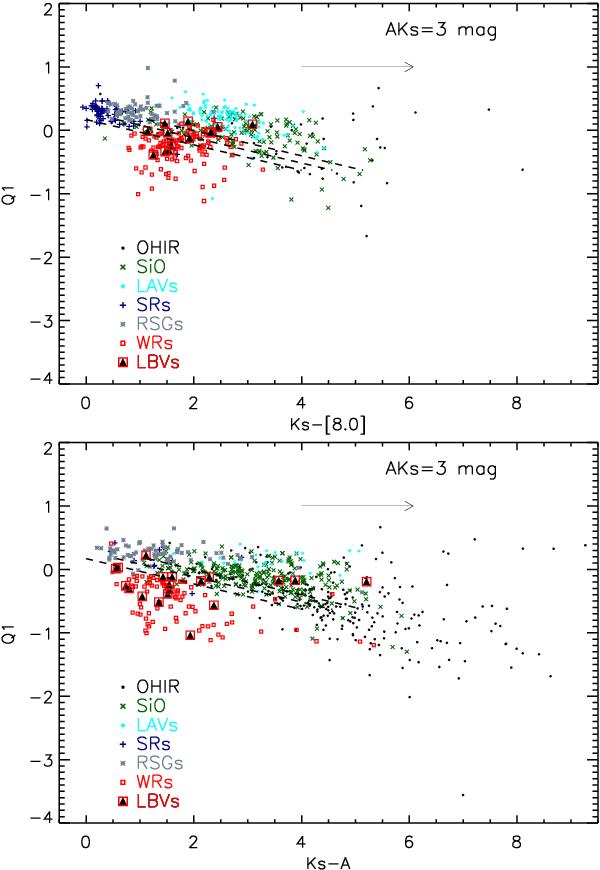
Q1 parameter versus Ks − [8.0] . Symbols are as in Fig. 1. In the top panel the GLIMPSE 8 μm measurements are plotted, while in the bottom panel the MSX 8 μm measurements (A-band) are plotted. The arrow represents the reddening vector following the extinction ratios given by Messineo et al. (2005) and Indebetouw et al. (2005). The dashed lines are a linear fit to the Q1 versus the dereddened (Ks − [8.0] ) values of SiO masing stars (Messineo 2004) for AK = 0, 1, 2 mag (from bottom to top). Typical errors are 0.05 mag in the x-axis and 0.14 mag in the y-axis.
Current usage metrics show cumulative count of Article Views (full-text article views including HTML views, PDF and ePub downloads, according to the available data) and Abstracts Views on Vision4Press platform.
Data correspond to usage on the plateform after 2015. The current usage metrics is available 48-96 hours after online publication and is updated daily on week days.
Initial download of the metrics may take a while.