Fig. 10
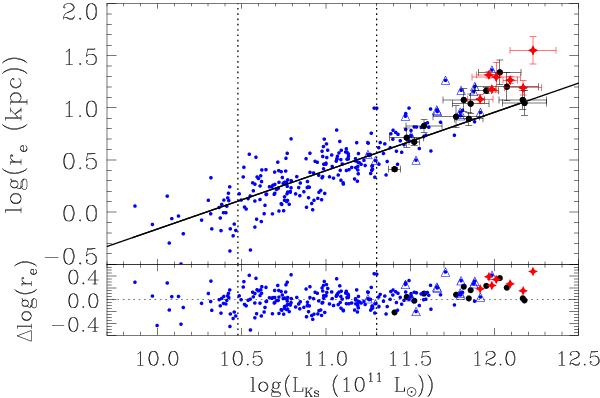
Distribution of our BGGs (red stars and large black points) and P98 early-type galaxies (small blue points) in the log re vs. log LKs plane. The BCGs in the P98 sample are marked by blue open triangles. The solid line represents the best fit to the galaxies in the luminosity range 3 × 10¹⁰ < LKs/L⊙ < 2 × 10¹¹ as done by Bernardi et al. (2011b). Red stars and large black points represent BGGs with ellipticities ϵ > 0.3 and ϵ ≤ 0.3, respectively. The bottom panel represents the residuals from the best fit.
Current usage metrics show cumulative count of Article Views (full-text article views including HTML views, PDF and ePub downloads, according to the available data) and Abstracts Views on Vision4Press platform.
Data correspond to usage on the plateform after 2015. The current usage metrics is available 48-96 hours after online publication and is updated daily on week days.
Initial download of the metrics may take a while.