Fig. 6
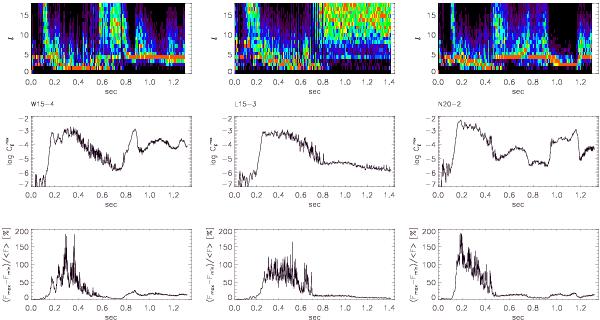
Pseudo-power spectrogram of the electron-neutrino energy flux density (top
row) for models W15-4 (left), L15-3
(middle), and N20-2 (right), respectively. The
panels in the middle row show the corresponding maximum
pseudo-power coefficient  as a
function of time, and the panels in the lower row give the relative
angular variation of the electron neutrino flux density (maximum minus minimum flux
density on the sphere divided by the angle-averaged flux density in percent) with
time.
as a
function of time, and the panels in the lower row give the relative
angular variation of the electron neutrino flux density (maximum minus minimum flux
density on the sphere divided by the angle-averaged flux density in percent) with
time.
Current usage metrics show cumulative count of Article Views (full-text article views including HTML views, PDF and ePub downloads, according to the available data) and Abstracts Views on Vision4Press platform.
Data correspond to usage on the plateform after 2015. The current usage metrics is available 48-96 hours after online publication and is updated daily on week days.
Initial download of the metrics may take a while.