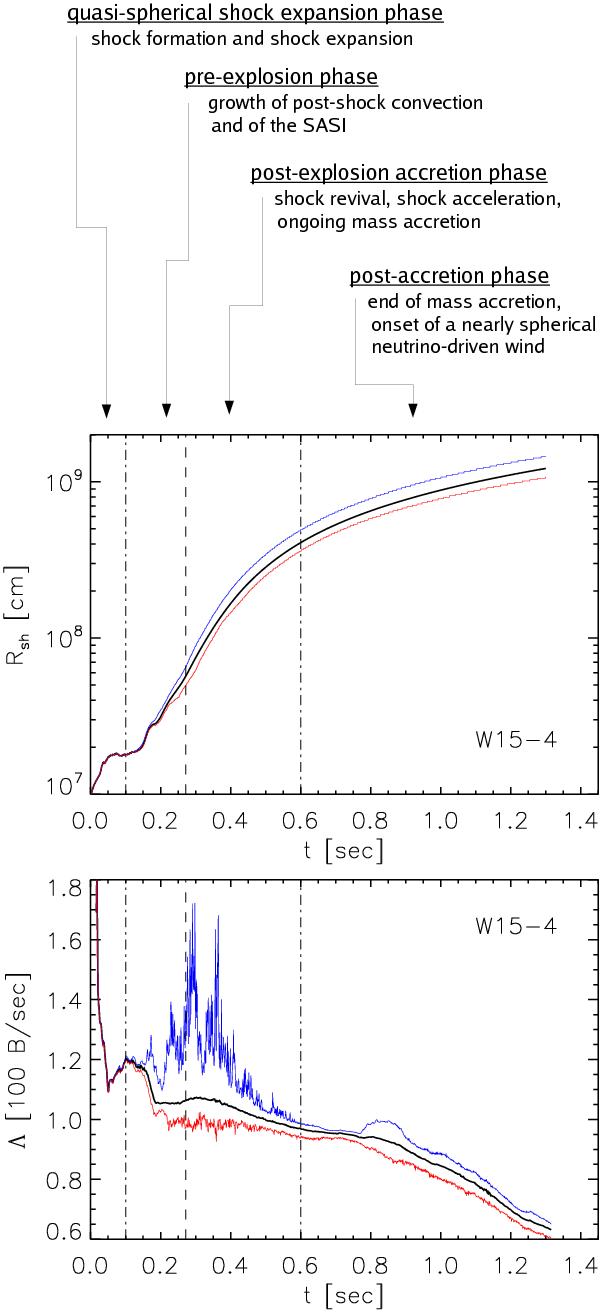
Fig. 3

Shock radius (top) and total (i.e., summed over all flavors) energy loss rate due to neutrinos (bottom) as functions of time for model W15-4. In the upper panel, the black curve shows the angle-averaged mean shock radius, the blue (red) curve gives the maximum (minimum) shock radius, and the vertical dashed line marks the time of the onset of the explosion as defined in Sect. 2.3. In the lower panel, the blue and red curves show the time evolution of Λmax(Ω,t) and Λmin(Ω,t), the maximum and minimum value of Λ(Ω,t) (Eq. (8)) on a sphere of 500 km radius, respectively. The black line gives the corresponding surface-averaged value Λ(t) (Eq. (13)). Note that the luminosities imposed at the inner radial grid boundary are kept constant during the first second and later are assumed to decay like t−2/3.
Current usage metrics show cumulative count of Article Views (full-text article views including HTML views, PDF and ePub downloads, according to the available data) and Abstracts Views on Vision4Press platform.
Data correspond to usage on the plateform after 2015. The current usage metrics is available 48-96 hours after online publication and is updated daily on week days.
Initial download of the metrics may take a while.


