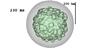
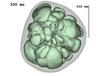
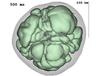
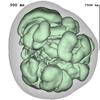
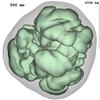
Fig. 2
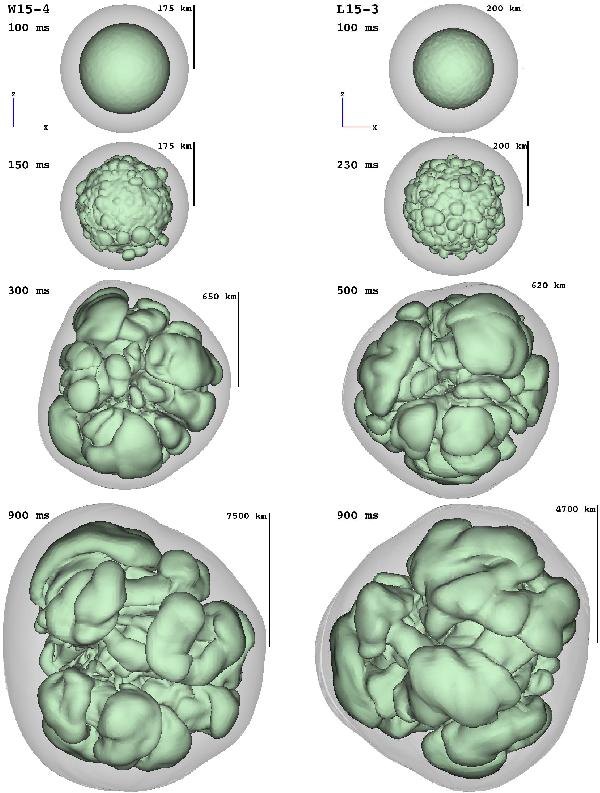
Snapshots of models W15-4 (left) and L15-3 (right) illustrating the four phases characterizing the evolution of our 3D models (see text for details). Each snapshot shows two surfaces of constant entropy marking the position of the shock wave (gray) and depicting the growth of non-radial structures (greenish). The time and linear scale are indicated for each snapshot.
Current usage metrics show cumulative count of Article Views (full-text article views including HTML views, PDF and ePub downloads, according to the available data) and Abstracts Views on Vision4Press platform.
Data correspond to usage on the plateform after 2015. The current usage metrics is available 48-96 hours after online publication and is updated daily on week days.
Initial download of the metrics may take a while.