Fig. 16
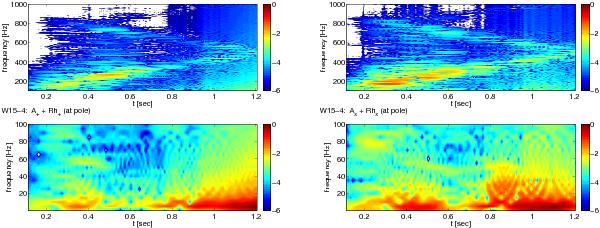
Normalized (to the absolute maximum) amplitude spectrograms of the total gravitational wave amplitudes A+ + Rh+ (left panels) and A× + Rh× (right panels) at the pole for model W15-4. The lower panels show the spectrograms in the frequency range 5 Hz to 100 Hz, and the upper ones in the frequency range 100 Hz to 1 kHz.
Current usage metrics show cumulative count of Article Views (full-text article views including HTML views, PDF and ePub downloads, according to the available data) and Abstracts Views on Vision4Press platform.
Data correspond to usage on the plateform after 2015. The current usage metrics is available 48-96 hours after online publication and is updated daily on week days.
Initial download of the metrics may take a while.