Fig. 15
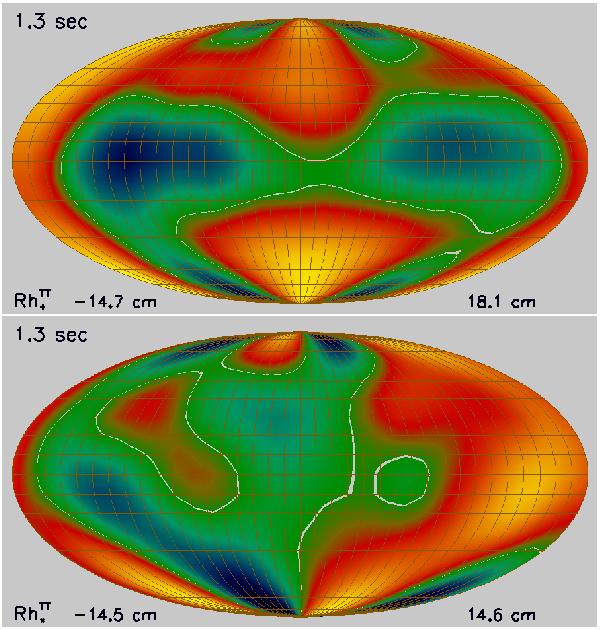
Gravitational wave amplitudes due to anisotropic mass flow and neutrino emission,
 (top) and
  (bottom), as functions of the observer angles (see Fig. 10) for model W15-4 at 1.3 s past bounce. The
white contours give the locations, where the amplitudes are zero. Yellow and red
areas indicate positive amplitudes, green and blue negative ones.
(bottom), as functions of the observer angles (see Fig. 10) for model W15-4 at 1.3 s past bounce. The
white contours give the locations, where the amplitudes are zero. Yellow and red
areas indicate positive amplitudes, green and blue negative ones.
Current usage metrics show cumulative count of Article Views (full-text article views including HTML views, PDF and ePub downloads, according to the available data) and Abstracts Views on Vision4Press platform.
Data correspond to usage on the plateform after 2015. The current usage metrics is available 48-96 hours after online publication and is updated daily on week days.
Initial download of the metrics may take a while.