Fig. 12
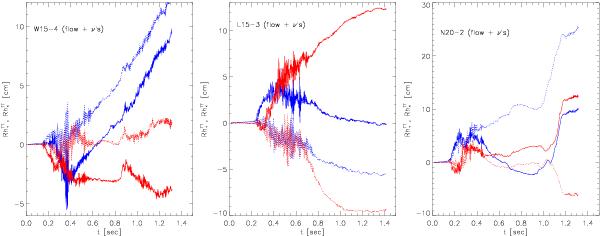
Gravitational wave amplitudes  (blue)
and
(blue)
and  (red)
due to anisotropic mass flow and neutrino emission as a function of time for models
W15-4 (left), L15-3 (middle), and N20-3
(right), respectively. The solid curves show the amplitudes for
an observer located above the north pole
(α = β = 0; see Fig. 10) of the source, while the other curves give the amplitudes at
the equator (α = 0,
β = π/2).
(red)
due to anisotropic mass flow and neutrino emission as a function of time for models
W15-4 (left), L15-3 (middle), and N20-3
(right), respectively. The solid curves show the amplitudes for
an observer located above the north pole
(α = β = 0; see Fig. 10) of the source, while the other curves give the amplitudes at
the equator (α = 0,
β = π/2).
Current usage metrics show cumulative count of Article Views (full-text article views including HTML views, PDF and ePub downloads, according to the available data) and Abstracts Views on Vision4Press platform.
Data correspond to usage on the plateform after 2015. The current usage metrics is available 48-96 hours after online publication and is updated daily on week days.
Initial download of the metrics may take a while.