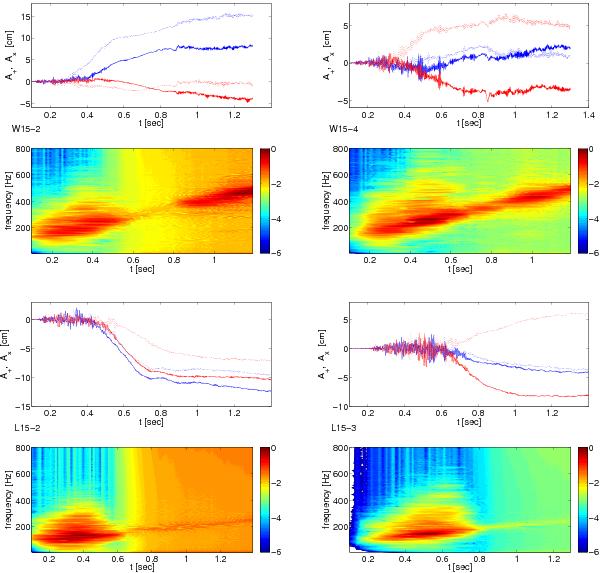
Fig. 11

The four panels show the gravitational wave amplitudes (top) and spectrograms of dEM/dν (bottom; normalized to the absolute maximum) arising from non-spherical mass flow of models W15-2 (top left), W15-4 (top right), L15-2 (bottom left), and L15-3 (bottom right), respectively. Blue curves give the amplitude A+ at the pole (solid) and the equator (dotted), while red curves show the other independent mode of polarization A× from the same directions.
Current usage metrics show cumulative count of Article Views (full-text article views including HTML views, PDF and ePub downloads, according to the available data) and Abstracts Views on Vision4Press platform.
Data correspond to usage on the plateform after 2015. The current usage metrics is available 48-96 hours after online publication and is updated daily on week days.
Initial download of the metrics may take a while.


