Fig. 3
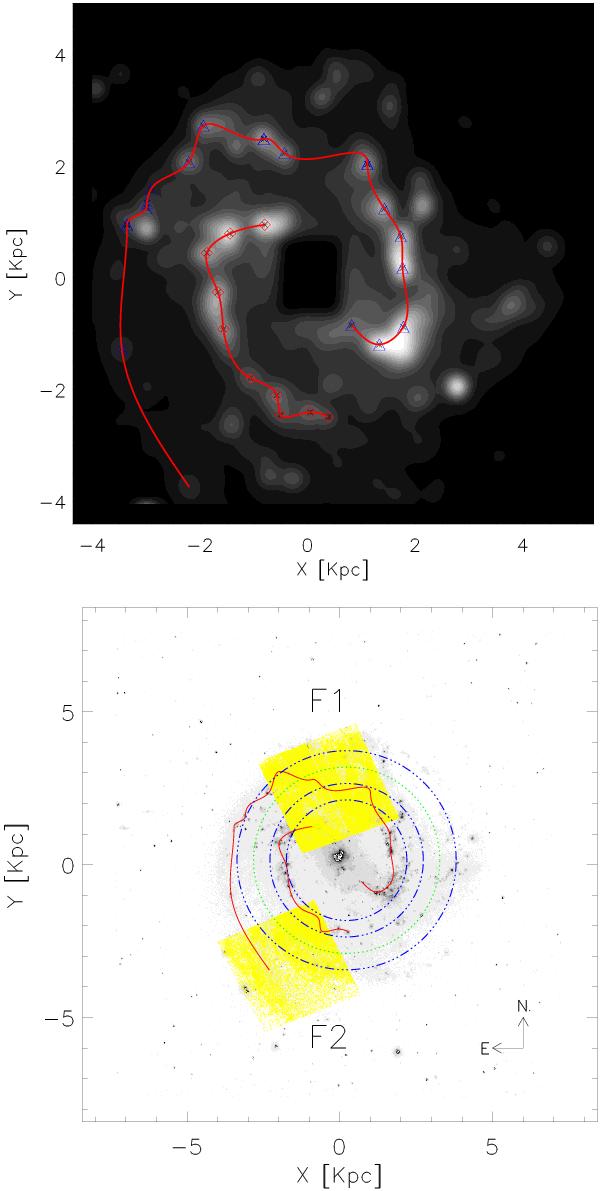
Upper panel: blurred image used for the detection of pronounced Hα regions. Lower panel: original CTIO image of NGC 5236. Overplotted in each panel are the estimated locations of the arms. In the lower panel the two fields observed with the HST/ACS are marked as yellow regions. Green dot-dashed line is the corotation radius located at 170′′ (Lundgren et al. 2004). Dash-dotted lines in blue denote annuli at 200 0, 1400 and 1100, see text for details.
Current usage metrics show cumulative count of Article Views (full-text article views including HTML views, PDF and ePub downloads, according to the available data) and Abstracts Views on Vision4Press platform.
Data correspond to usage on the plateform after 2015. The current usage metrics is available 48-96 hours after online publication and is updated daily on week days.
Initial download of the metrics may take a while.