Free Access
Fig. 2
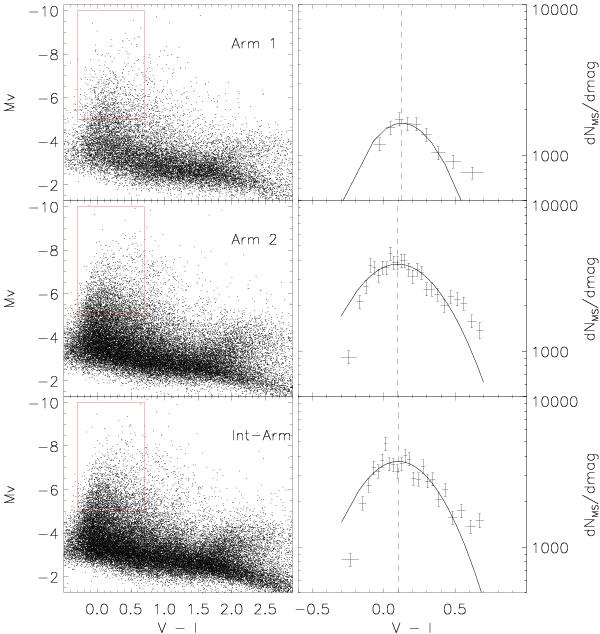
Left column: color–magnitude diagrams for the Arm 1, Arm 2, and inter-arm regions. Right column: histogram of colors of main sequence stars inside the boxes marked over the CMDs. Errors are Poissonian. Vertical dashed lines represent the peak of the Gaussian distributions.
Current usage metrics show cumulative count of Article Views (full-text article views including HTML views, PDF and ePub downloads, according to the available data) and Abstracts Views on Vision4Press platform.
Data correspond to usage on the plateform after 2015. The current usage metrics is available 48-96 hours after online publication and is updated daily on week days.
Initial download of the metrics may take a while.