Free Access
Fig. 10
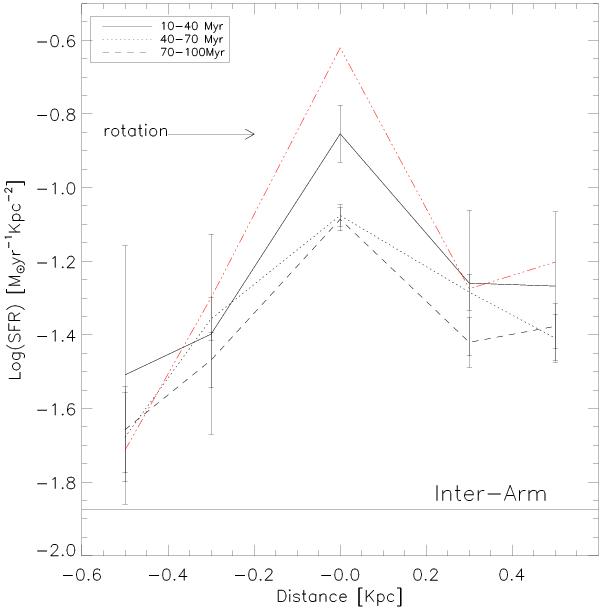
Spatial variation of ΣSFR across the Arm 2, observed in field 1. The values are averaged over age every 30 Myr. Errors are the standard deviation of the mean. Red dash-dotted line represent the number of massive, bright stars in the main sequence normalized by the are, see text for details.
Current usage metrics show cumulative count of Article Views (full-text article views including HTML views, PDF and ePub downloads, according to the available data) and Abstracts Views on Vision4Press platform.
Data correspond to usage on the plateform after 2015. The current usage metrics is available 48-96 hours after online publication and is updated daily on week days.
Initial download of the metrics may take a while.