Fig. 3
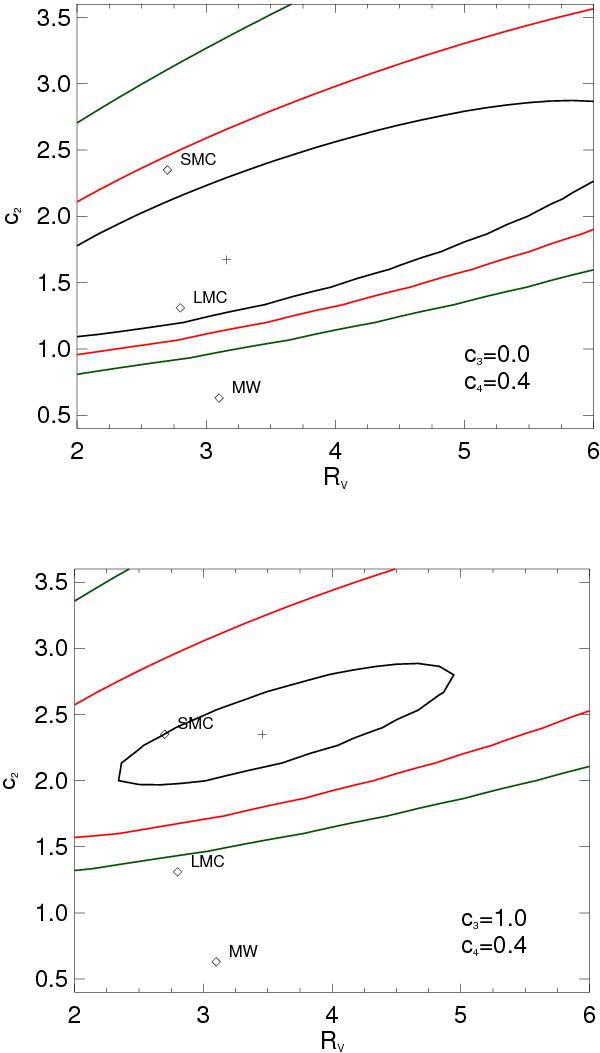
2-dimensional contour plot of c2 against RV for c3 = 0.0 (top) and c3 = 1.0 (bottom), and c4 = 0.4 in both cases. In both panels, the inner (black), middle (red) and outer (green) contours correspond to 68.3%, 90% and 99% confidence intervals, respectively. The best-fit c2 and RV values are indicated by a black cross, and the corresponding [RV,c2] pairs for the mean SMC, LMC and Milky Way (MW) extinction curve are also shown.
Current usage metrics show cumulative count of Article Views (full-text article views including HTML views, PDF and ePub downloads, according to the available data) and Abstracts Views on Vision4Press platform.
Data correspond to usage on the plateform after 2015. The current usage metrics is available 48-96 hours after online publication and is updated daily on week days.
Initial download of the metrics may take a while.